Analyze Model Performance
Performance Baselines
Section titled “Performance Baselines”Best practices for building performance baselines
Section titled “Best practices for building performance baselines”-
Establish evaluation metrics
When building a performance baseline, it is essential to establish appropriate evaluation metrics that align with the specific problem and business objectives. Common metrics include accuracy, precision, recall, F1-score, mean squared error, and area under the receiver operating characteristic curve (AUC-ROC) depending on the task such as classification, regression, or ranking.
-
Start with a simple model
To create a robust baseline, we recommend that you to start with a simple model, such as a linear regression, and evaluate its performance on the validation and test datasets. This initial baseline serves as a reference point and provides insights into the complexity of the problem. Subsequently, more sophisticated models can be explored, and their performance can be compared against the baseline to quantify the improvements.
-
Ensure real-world data
It is crucial to ensure that the evaluation datasets are representative of the real-world data distribution and do not contain any leakage or bias. Proper data preprocessing, handling of missing values, and feature engineering should be applied consistently across the training, validation, and test datasets to maintain the integrity of the evaluation process.
Assessing trade-offs
Section titled “Assessing trade-offs”Balance model performance, training time, and cost
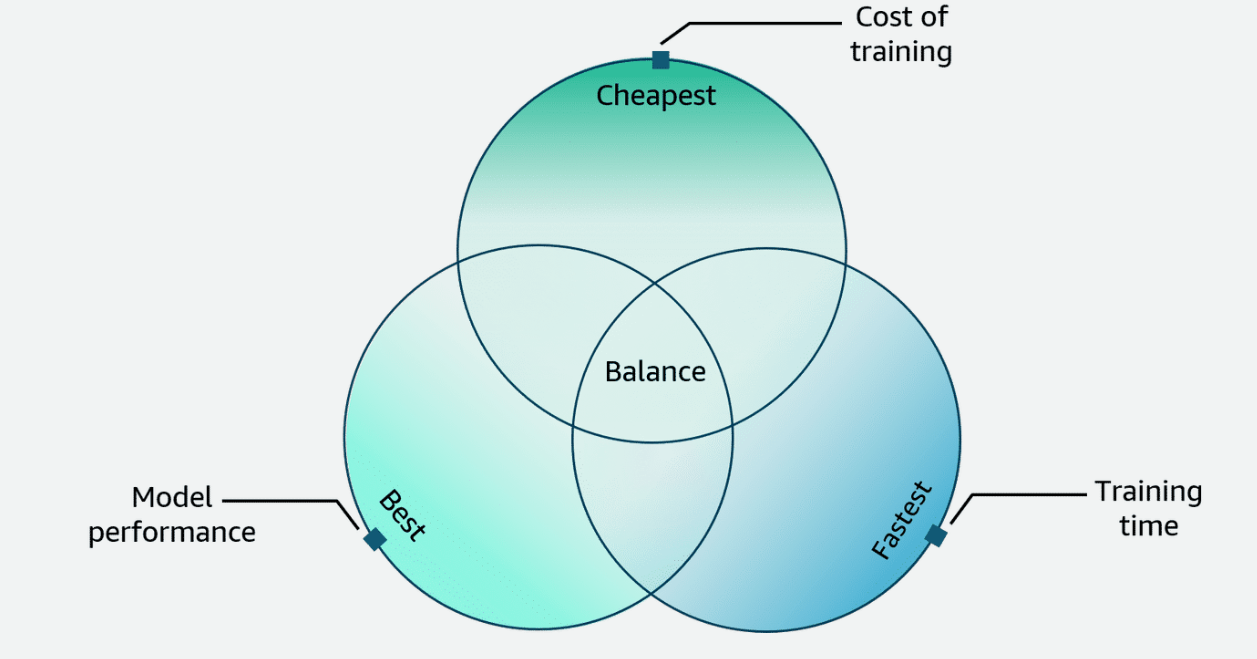
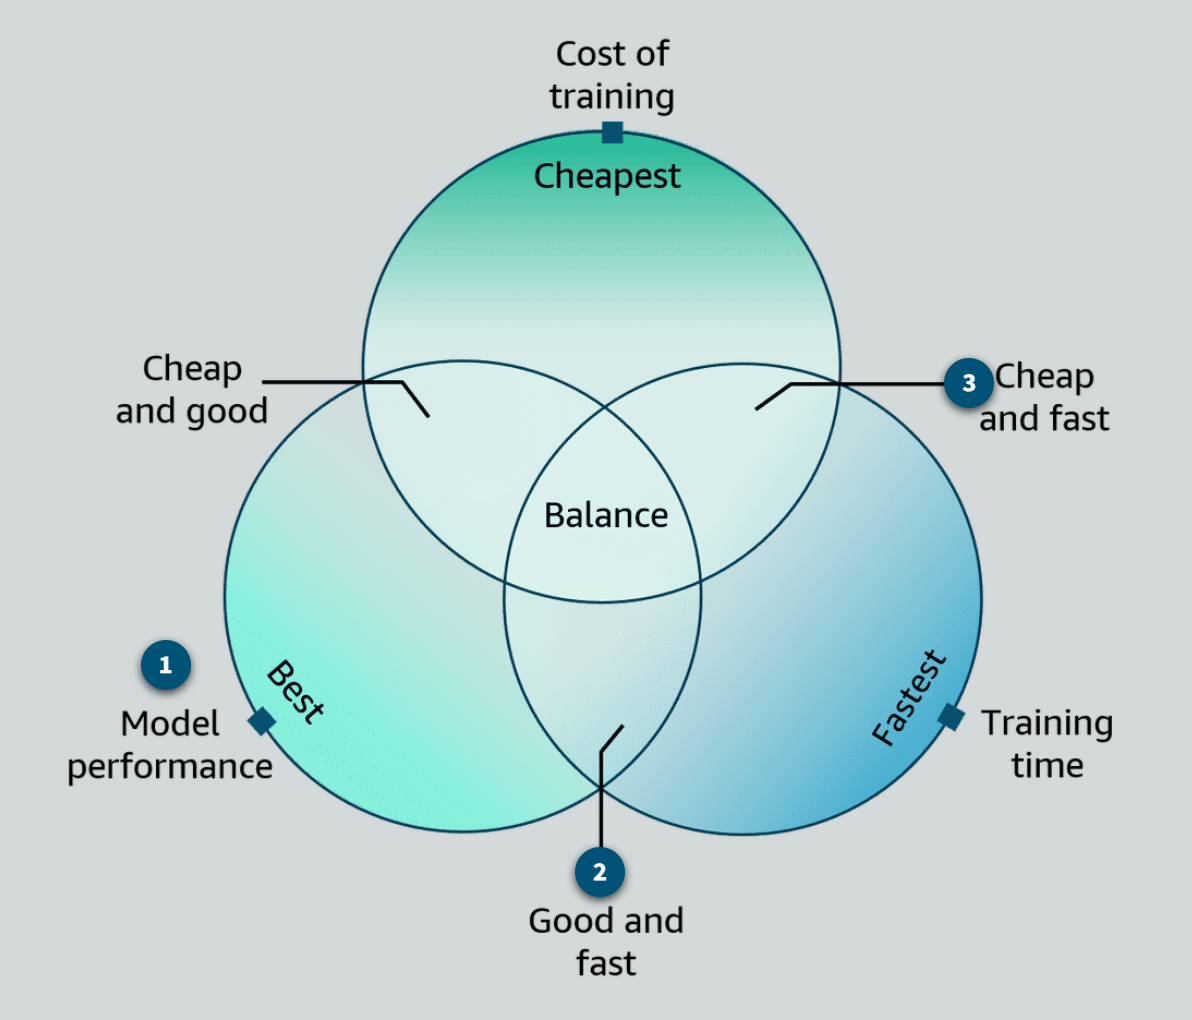
Striking the right balance between model performance, training time, and cost when working with machine learning workloads is important. These three factors are interconnected. If you optimize one, you might impact the others. In this section, you will explore the trade-offs.

-
Model performance
Model performance refers to the accuracy, precision, and other metrics that measure how well a model performs on a given task. Generally, more complex models with a larger number of parameters tend to achieve better performance, but they also require more computational resources and longer training times. Improving model performance often involves techniques like increasing model depth, using more advanced architectures, or incorporating additional data.
Additional factors that impact model performance include feature engineering, data quality, hyperparameter tuning, regularization, and the choice of optimization algorithm. -
Cost of training
The cost of training and deploying machine learning models is a crucial consideration, especially in cloud environments like AWS. Factors that contribute to cost include the type and number of compute instances used, the amount of data storage required, and the duration of training and inference. More powerful compute resources and longer training times generally lead to higher costs. AWS offers a range of cost-effective solutions, such as Amazon Elastic Compute Cloud (Amazon EC2) instances optimized for machine learning, Amazon SageMaker, and AWS Inferentia chips, to help you manage costs while maintaining performance.
-
Training time
Training time is the duration required to train a machine learning model on a given dataset. Longer training times are typically associated with larger datasets, more complex models, and more extensive hyperparameter tuning. Although faster training times are desirable for rapid iteration and experimentation, they can come at the cost of reduced model performance.
How to choose
Section titled “How to choose”
- Priority solely on model performance
Use more complex models and allocate more computational resources, even if it means longer training times and higher costs.
- Model performance and time priorities
Use moderately complex models and moderately sized datasets with more computational resources. With this approach, understand the increased costs.
- Cost and time priorities
If time and cost are the primary concerns, simpler models and less powerful compute instances might be preferred. With this approach, understand that performance might be compromised.
To assess these trade-offs, you can use AWS services like Amazon SageMaker Debugger and Amazon SageMaker Model Monitor to analyze your model’s performance, resource use, and cost. Additionally, AWS provides tools like AWS Cost Explorer and AWS Budgets to monitor and optimize your spending.
Model Evaluation
Section titled “Model Evaluation”Model Evaluation Techniques and Metrics
Section titled “Model Evaluation Techniques and Metrics”Using data you set aside
-
Validation helps identify where your model needs improvement
To begin evaluating how your model responds in a non-training environment, you want to start by looking at the data you set aside as your validation set. This is because you want to make sure that the model generalizes to data it has not seen, and because you will still want to make improvements to the model before determining that it’s ready for production.
-
Evaluation determines how well your model will predict the label on future data
After you’ve improved your model using that validation data, you’re ready to test it one last time to ensure its predictive quality meets your standards. This is where you will use your testing dataset, the last 10 percent, to evaluate your model.
Model metrics
-
Regression problems
- MSE
- RMSE
- R-squared
- Adjusted R-squared
-
Classification problems
-
Confusion Matrix
-
True positive
If the actual label or class is a cat, which is identified as P for positive in the confusion matrix, and the predicted label or class is also cat, then you have a true positive result. This is a good outcome for your model.
-
True negative
Similarly, if you have an actual label of not cat, which is identified as N for negative in the confusion matrix, and the predicted label or class is also not cat, then you have a true negative. This is also a good outcome for your model.
-
False positive
There are two other possible outcomes, both of which are less than ideal. The first is when the actual case is negative, not cat, but the predicted class is positive, cat. This is called a false positive because the prediction is positive but incorrect.
-
False negative
The second, less than ideal outcome is a false negative. A false negative occurs when the actual class is positive, cat, but the predicted class is negative, not cat.
-
-
Accuracy
Accuracy is the ratio of the number of matching predictions (TP + TN) to the total number of instances (TP + TN + FP + FN). Accuracy is a good metric unless the dataset has a severe target imbalance.
-
Precision
Precision is best when the cost of false positives is high.
Think about a classification model that identifies emails as spam or not. In this case, you don’t want your model labeling an important email as spam and preventing your users from seeing it when the email was legitimate.
-
Recall
Recall is best when the cost of false negatives is high.
Think about an example of a model that needs to predict whether or not a patient has a terminal illness or not. In this case, using precision as your evaluation metric does not account for the false negatives in your model. It is vital to the success of the model that it does not identify a patient as illness-free when that patient actually does have that illness.
-
F1 Score
F1 Score helps express precision and recall with a single value.
You should look at using the F1 score when you have a class imbalance, but also want to preserve the equality between precision and recall.
-
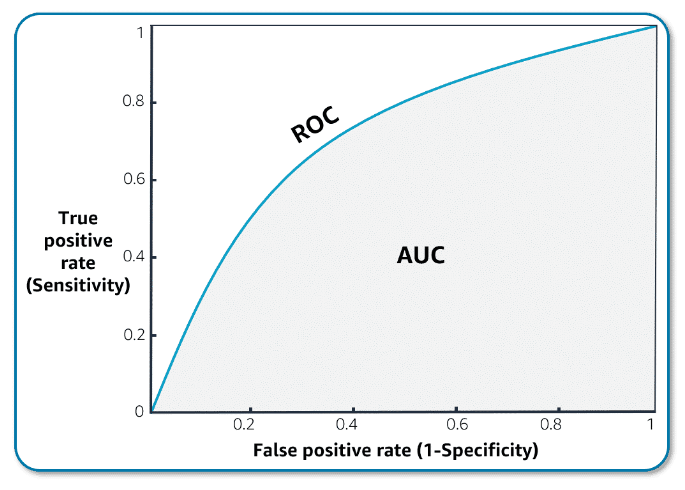
AUC-ROC
AUC-ROC helps in selecting good classifiers.

Graph of AUC-ROC uses sensitivity (true positive rate) and specificity (false positive rate)
-
-
Regression problems
-
Mean Squared Error
-
-
Root Mean Squared Error
-
R-squared
R-squared is another commonly used metric with linear regression problems. R-squared explains the fraction of variance accounted for by the model. It’s like a percentage, reporting a number from zero to one. When R squared is close to one, it usually indicates that a lot of the variabilities in the data can be explained by the model.
-
Adjusted R-squared
To counter this potential issue, there’s another metric called adjusted R-squared. The adjusted R-squared has already accounted for the added effect for additional variables. It only increases when the added variables have significant effects in the prediction. The adjusted R-squared adjusts your final value, based on the number of features and number of data points you have in your dataset. A recommendation, therefore, is to look at both R-squared and adjusted R-squared. This will ensure that your model is performing well, but that there is not too much overfitting.
Convergence Issues
Section titled “Convergence Issues”Mitigating convergence issues with Amazon SageMaker Automatic Model Tuning (AMT)
Amazon SageMaker AMT helps to mitigate convergence issues and improves the model training process. SageMaker AMT can automatically tune the hyperparameters of your machine learning models to find the best configuration for your specific use case. This service can help overcome convergence issues by exploring different combinations of hyperparameters to find the optimal settings that lead to better convergence and model performance. These hyperparameters include learning rates, batch sizes, and regularization techniques.
How Amazon SageMaker Training Compiler can help
Amazon SageMaker Training Compiler is a capability of SageMaker that makes these hard-to-implement optimizations to reduce training time on GPU instances. The compiler optimizes DL models to accelerate training by more efficiently using SageMaker machine learning GPU instances. It automatically applies graph and tensor optimization, enabling the efficient utilization of hardware resources and reducing training time. SageMaker Training Compiler is available at no additional charge within SageMaker and can help reduce total billable time as it accelerates training. SageMaker Training Compiler can improve the convergence speed as well as the stability of the training process.
Conclusion
Convergence issues pose common challenges in machine learning during post-training evaluation, but AWS offers powerful tools and resources to help mitigate these problems. By using services like SageMaker AMT and SageMakerTraining Compiler, you can improve the convergence of your machine learning models and achieve better performance in your applications.
Debug Model Convergence with SageMaker Debugger
Section titled “Debug Model Convergence with SageMaker Debugger”Identifying and resolving issues
Section titled “Identifying and resolving issues”SageMaker Debugger: Monitoring and debugging ML models
SageMaker Debugger is a capability of SageMaker that allows you to monitor and debug machine learning models during training and deployment. It provides insights into the model’s performance, accuracy, and potential issues, enabling you to identify and resolve problems before deploying the model to production.
-
Improved Model Performance
By monitoring and analyzing the model’s behavior during training, SageMaker Debugger helps identify issues such as overfitting, underfitting, or data quality problems. This allows you to make informed decisions and adjustments to improve the model’s performance and accuracy.
-
Explainability and Bias Detection
SageMaker Debugger provides insights into the model’s decision-making process, helping you understand how the model arrives at its predictions. It also identifies potential biases in the model, ensuring fairness and compliance with regulatory requirements.
-
Automated Monitoring and Alerts
SageMaker Debugger continuously monitors the model’s performance during training and deployment, alerting you to any deviations or anomalies. This proactive approach helps you address issues promptly, minimizing the risk of deploying suboptimal models.
-
Debugging Capabilities
With its debugging features, SageMaker Debugger allows you to inspect the model’s internal state, visualize data distributions, and analyze feature importance. This empowers you to identify and troubleshoot issues more effectively.
To learn more, visit Use Amazon SageMaker Debugger to debug and improve model performance
SageMaker Clarify and Metrics Overview
Section titled “SageMaker Clarify and Metrics Overview”For post-training evaluation and explainability
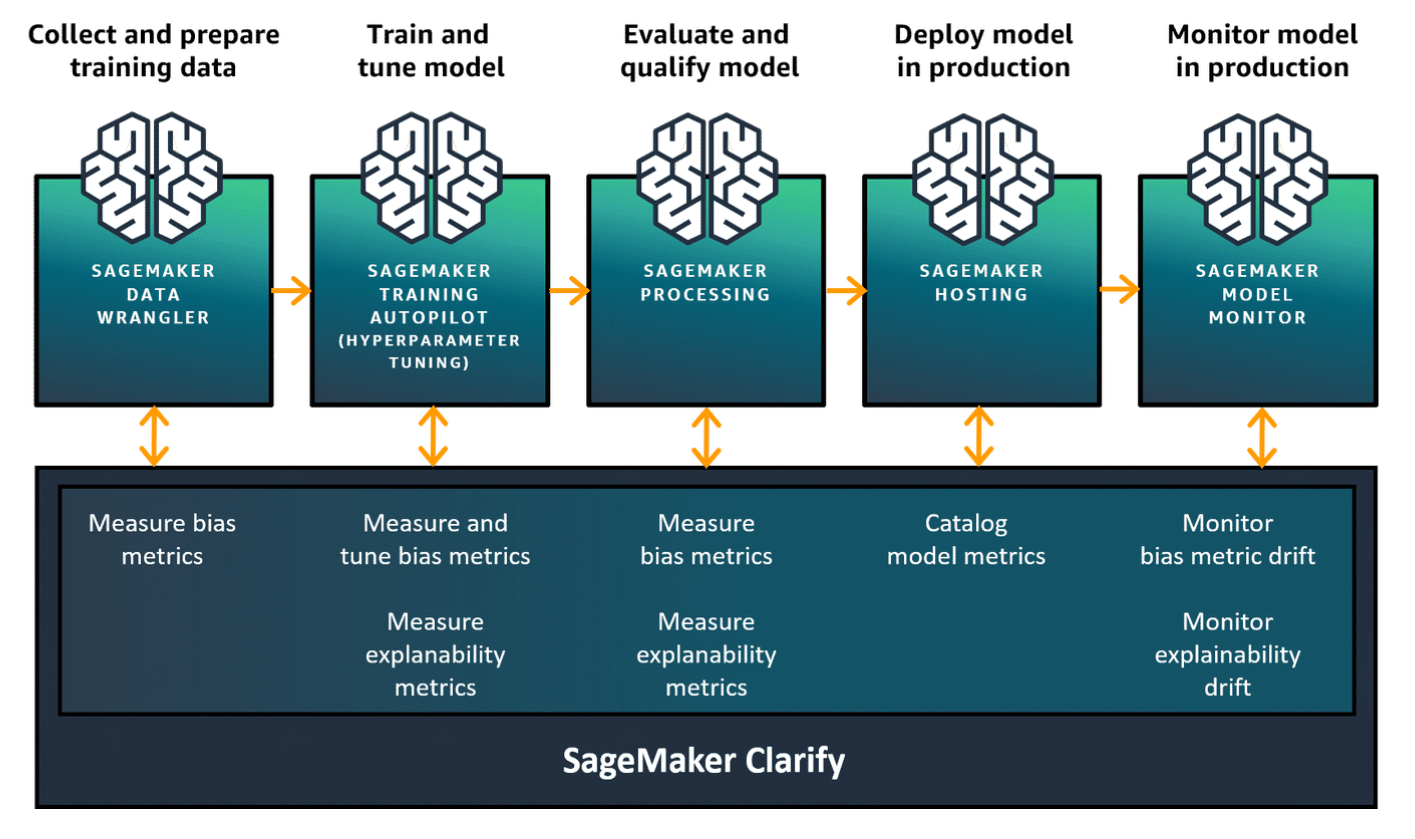
SageMaker Clarify is a feature within Amazon SageMaker that helps you monitor, explain, and improve the fairness and transparency of your machine learning models. It provides a suite of bias detection, explainability, and data quality monitoring tools that can be applied to your models throughout the ML lifecycle.
SageMaker Clarify in the ML lifecycle

-
Explain machine learning models
SageMaker Clarify helps to explain machine learning models and assess your data and models for bias.
-
Detect drift in bias during data preparation
SageMaker Clarify helps detect bias across attributes in your training data utilizing nine different pre-training detection methods.
-
Detect bias in your trained model
SageMaker Clarify helps detect bias in your trained model. It also helps evaluate the degree to which various types of bias are present in your model utilizing nine different post-training detection methods.
-
Explain both global and local predictions
SageMaker Clarify helps explain both global and local predictions. It helps you understand the relative importance of each feature to your model’s overall behavior and individual predictions. Note: Global methods have access to more training data by fitting a single method over multiple time series. This can lead to better generalizations than traditional local forecasting methods, which estimate a single method per time series.
-
Explain decisions made by computer vision or natural language processing
SageMaker Clarify helps you understand how computer vision (CV) or natural language processing (NLP) model predictions are being made in unstructured data models that are typically black box in their approach.
-
Detect drift in bias and model behavior over time
SageMaker Clarify provides alerts and detects drift over time in SageMaker Model Monitor to understand changes due to dynamic real-world conditions.
-
Provide model reports
SageMaker Clarify can provide visual reports with descriptions of the sources and severity of possible bias so that you can plan steps to mitigate.
To learn more about how to use SageMaker Clarify, visit Use SageMaker Clarify.
Metrics
Section titled “Metrics”-
Data bias metrics
- Class Imbalance: Measures the imbalance in the distribution of classes or labels in your training data.
- Facet Imbalance: Evaluates the imbalance in the distribution of facets or sensitive attributes, such as age, gender, or race across different classes or labels.
- Facet Correlation: Measures the correlation between facets or sensitive attributes and the target variable.
-
Model bias metrics
- Differential validity: Evaluates the difference in model performance such as accuracy, precision, and recall across different facet groups.
- Differential prediction bias: Measures the difference in predicted outcomes or probabilities for different facet groups, given the same input features.
- Differential feature importance: Analyzes the difference in feature importance across different facet groups, helping to identify potential biases in how the model uses features for different groups.
-
Model explanability metrics
- SHAP (SHapley Additive exPlanations): Provides explanations for individual predictions by quantifying the contribution of each feature to the model’s output.
- Feature Attribution: Identifies the most important features contributing to a specific prediction, helping to understand the model’s decision-making process.
- Partial Dependence Plots (PDPs): Visualizes the marginal effect of one or more features on the model’s predictions, helping to understand the relationship between features and the target variable.
-
Data quality metrics
- Missing Data: Identifies the presence and distribution of missing values in your training data.
- Duplicate Data: Detects duplicate instances or rows in your training data.
- Data Drift: Measures the statistical difference between the training data and the data used for inference or production, helping to identify potential distribution shifts.
Interpret Model Outputs Using SageMaker Clarify
Section titled “Interpret Model Outputs Using SageMaker Clarify”-
Feature importance explanations
Feature importance explanations show how each input feature contributes to the model’s predictions. This can help you understand which features are driving the model’s decisions and identify potential biases or unfair treatment based on sensitive features like gender, race, or age.
-
Shapley additive explanations (SHAP)
SageMaker Clarify supports SHAP, a game-theoretic approach to explain the output of any machine learning model. SHAP calculates the contribution of each feature to the model’s prediction, providing a local explanation for individual predictions. This can help you understand how the model arrived at a specific prediction and identify potential biases or unfair treatment for that particular instance.
-
Partial dependence plots (PDPs)
PDPs are graphical representations that show the marginal effect of one or two features on the model’s predictions. SageMaker Clarify can generate PDPs, helping you visualize how the model’s predictions change as the values of specific features change, while holding all other features constant. This can help you identify potential biases or unfair treatment based on specific feature values.
-
Bias metrics
SageMaker Clarify provides a set of bias metrics that measure the fairness of your model’s predictions across different demographic groups. These metrics include disparate impact, demographic parity, and equal opportunity difference, among others. By analyzing these metrics, you can identify potential biases or unfair treatment towards specific groups in your data.
-
Data quality reports
SageMaker Clarify can generate data quality reports that provide insights into the distribution and quality of your training data. These reports can help you identify potential issues like data imbalance, missing values, or outliers, which can contribute to biased or unfair model predictions.
Amazon SageMaker Experiments
Section titled “Amazon SageMaker Experiments”-
Organize
SageMaker Experiments allows you to organize runs with metrics, parameters, and tags.
-
Reproduce
SageMaker Experiments helps with reproducibility by logging code, data, and models.
-
Support
SageMaker Experiments provides support for any ML library or language.
-
Deploy
SageMaker Experiments includes a central model registry for deployment.
-
Track
SageMaker Experiments provides scalable tracking for many parallel experiments.
To learn more, visit Manage Machine Learning with Amazon SageMaker Experiments.
Resources
Section titled “Resources”-
Use this resource to learn more about the tools SageMaker Clarify uses to help explain how ML models make predictions.
-
Explanations for your datasets and models
Visit this resource to learn how to use SageMaker Clarify to explain and detect bias for your datasets and models.
-
Online explainability with SageMaker Clarify
Visit this resource to obtain explanations in real-time from a SageMaker endpoint.
-
Well Architected ML Lens Whitepaper
Visit this resource for best practices in discussing the level of explainability with stakeholders (section MLOE-02).
-
Visit this resource to learn about the tools SageMaker Debugger provides to improve the performance of your models.
-
Use this resource to learn how you can use SageMaker Experiments to create, manage, analyze, and compare your machine learning experiments.