Monitor Model Performance and Data Quality
Monitoring Machine Learning Solutions
Section titled “Monitoring Machine Learning Solutions”The importance of monitoring ML solutions
Section titled “The importance of monitoring ML solutions”
-
Meeting business requirements
Monitoring plays a vital role in aligning ML solutions with an organization’s business objectives. It helps answer the question: Are we achieving the desired outcomes?
By analyzing comprehensive system performance metrics, businesses can evaluate the return on investment (ROI) and make data-driven decisions regarding resource allocation and strategic adjustments.
For example, consider a recommendation engine that suggests products to customers on an ecommerce platform. The company’s primary goals are to increase customer satisfaction and boost sales through personalized recommendations. Monitoring key performance indicators (KPIs) such as click-through rates, conversion rates, and average order values for recommended products provides valuable insights into the engine’s effectiveness. This supports the company to optimize its recommendation strategies continuously. -
Monitoring infrastructure performance
ML solutions often require significant computational resources, and monitoring infrastructure performance to ensure that the system operates efficiently and scales properly with demand. This process involves monitoring key infrastructure metrics, such as CPU and GPU utilization, memory consumption, and network throughput. Consider a scenario where a cloud-based ML application experiences a sudden surge in user requests, leading to high CPU usage and slow response times. In such cases, monitoring tools can alert teams to scale resources as needed, avoiding service disruptions.
-
Evaluating model performance
Model monitoring is a critical process that evaluates a machine learning model’s performance in real-world scenarios. It assesses the model’s accuracy, efficiency, and overall effectiveness by measuring how well it generalizes to unseen data using relevant metrics. The specific metrics used vary depending on the problem type, such as regression or classification. For example, in classification tasks, key metrics might include precision, recall, F1-score, and inference time. Additionally, monitoring should evaluate the model’s performance on edge cases and potential failure modes. Detecting potential issues early through monitoring facilitates timely interventions to address any concerns and maintain optimal performance.
A practical example is a spam filter model that starts performing poorly because of changes in spamming techniques. By monitoring the model’s performance metrics, such as the false positive and false negative rates, administrators can identify the decline in accuracy. Then, they can initiate the retraining process with updated data. This proactive approach helps restore the system’s efficiency and ensures it remains effective against evolving spam tactics. -
Facilitating model retraining
As data evolves and external factors shift, models can become outdated and less reliable if not retrained. By tracking key metrics like data distribution changes and prediction performance, organizations can schedule timely retraining to keep their models effective.
For instance, a customer churn prediction model trained on historical customer data requires periodic retraining to adapt to evolving market conditions and customer behavior. Continuous monitoring of the model’s predictive accuracy prompts the marketing team to initiate retraining cycles, keeping predictions reliable and reflective of the current customer base. -
Ensuring compliance with regulations and industry standards
ML solutions must adhere to applicable rules and regulations. Monitoring processes protect user privacy, security, and fairness. This is important in industries like healthcare and finance, where AI and ML must follow strict rules and oversight.
Organizations must have monitoring frameworks that protect user data. These frameworks prevent unauthorized access or misuse of sensitive information. They follow data protection and ethical AI and ML principles. By being accountable and building trust, organizations can use AI and ML technologies responsibly.
The Machine Learning Lens: AWS Well-Architected Framework
Section titled “The Machine Learning Lens: AWS Well-Architected Framework”Best practices and design principles
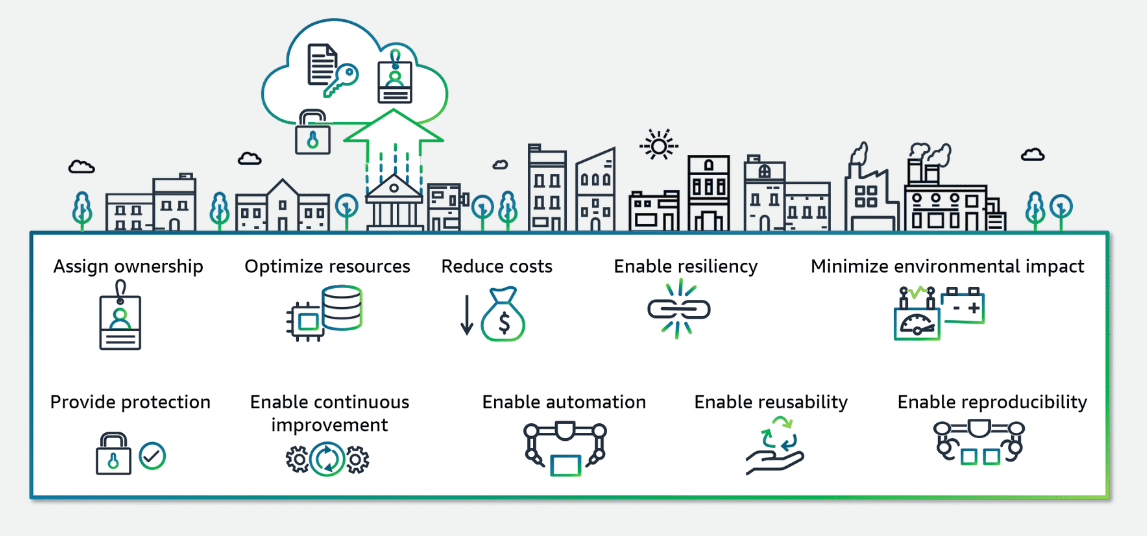
To learn more about the Machine Learning Lens: AWS Well-Architected Framework design principles, visit Machine Learning Lens.
-
Optimize Resources
The Machine Learning Lens helps efficiently use cloud resources, such as compute, storage, and networking, to meet the performance and scalability requirements of ML workloads while minimizing waste and over-provisioning. Effective resource management techniques are fundamental for ensuring the efficient and cost-effective operation of ML workloads on Amazon Web Services (AWS), with some best practices including the following:
- Resource pooling: Sharing compute, storage, and networking resources across multiple workloads can improve resource utilization and reduce costs.
- Caching: Implementing caching strategies for frequently accessed data or intermediate results can reduce computational overhead and improve performance.
- Data management: Implementing efficient data management practices, such as data compression, partitioning, and lifecycle management, can optimize storage and processing costs.
-
Scale ML workloads based on demand
ML workloads often experience fluctuations in demand, making it essential to scale resources up or down accordingly. AWS provides various services and tools to enable scalable ML deployments:
- AWS Auto Scaling can automatically adjust compute resources based on predefined scaling policies, ensuring that resources are provisioned or deprovisioned based on demand.
- SageMaker, a fully managed AWS ML service, provides built-in scaling capabilities for training and inference workloads so that resources can be scaled up or down as needed.
- Lambda, a serverless computing service, can be used for scaling ML inference workloads based on demand, eliminating the requirement to manage underlying compute resources.
-
Reduce Cost
Monitoring ML workloads can help you identify opportunities to optimize resource usage, use cost-effective services, and continuously manage costs for efficient and cost-effective ML workloads. One key best practice is to monitor usage and costs by ML activity using resource tagging. Associate tags like “training” or “inference” with your resources to conveniently track and optimize costs in each phase of the ML lifecycle.
It’s also important to monitor the return on investment (ROI) for your deployed ML models. Use dashboards to report on key business metrics with and without the model to quantify its value. If ROI is negative, you might want to optimize further by reducing latency, streamlining the model, or implementing triage. The following are examples of questions that can help uncover the return on investment (ROI):- If a model is used to support customer acquisition: How many new customers are acquired and what is their spend when the model’s advice is used compared with a baseline?
- If a model is used to predict when maintenance is required: What savings are being made by optimizing the maintenance cycle?
For hosted endpoints, continuously monitor resource utilization metrics like CPU, GPU, and memory usage. Use this data to right-size your instance types and take advantage of automatic scaling to provision just enough capacity. Scaling up during peaks and down during lulls can significantly reduce hosting costs.
-
Enable Continuous Improvement
Continuous improvement is a key component to help your models remain accurate and effective over time. This involves implementing feedback loops, monitoring performance, and automating processes for rapid iteration.
- Establish Feedback Loops: Gather feedback from stakeholders, subject matter experts, and end-users throughout the ML lifecycle. Analyze successes, failures, and operational activities to identify areas for improvement. Experiment with data augmentation, different algorithms, and training approaches until optimal outcomes are achieved. Document your findings to refine processes iteratively.
- Monitor Performance: Implement SageMaker Model Monitor to continually assess your models for concept drift and model drift, which can degrade accuracy over time. Configure Amazon CloudWatch to receive alerts on any deviations, aiding prompt remediation. Use the Amazon SageMaker Model Dashboard to centrally track performance metrics and historical behavior.
- Automate Retraining: Create Amazon EventBridge rules to activate an automated retraining pipeline when SageMaker Model Monitor detects anomalies or drifts. This facilitates rapid iteration and deployment of updated models to production environments, ensuring your ML solutions remain cutting-edge and high-performing.
To learn more about how to run a Machine Learning Lens review in your AWS account, see Run a Machine Learning Lens review in your AWS account.
Detecting Drift in Monitoring
Section titled “Detecting Drift in Monitoring”Types of Drift
Section titled “Types of Drift”-
Data Quality Drift
Production data distribution differs from data that is used for training. ML models in production must make predictions on real-life data that is not carefully curated like most training datasets. The statistical nature of the data your model receives in production might drift away from the nature of the baseline data it was trained on. In that case, the model begins to lose accuracy in its predictions.
-
Model Quality Drift
Model quality drift are predictions that a model makes that differ from actual ground truth labels that the model attempts to predict.
-
Bias Drift
Bias drift represents an increase in the bias that affects predictions that the model makes over time. Bias drift can be introduced by changes in the live data distribution, such as the following:
- Bias could be present in data that is used to train the model.
- For example, training data is too small or not representative of live data, and cannot teach the model.
- Training data incorporates existing societal assumptions, which introduces those biases into the model.
- An important data point is excluded from training data because of a lack of recognition of its importance.
- Bias could be introduced in the real-world data that the model interacts with.
Note: Bias differs from variance, which is the level of small fluctuations or noise common in complex data sets. Bias tends to cause model predictions to overgeneralize, and variance tends to cause models to undergeneralize. Increasing variance is one method for reducing the impact of bias.
- Bias could be present in data that is used to train the model.
-
Feature Attribution Drift
Feature attribution drift or concept drift is when the contribution of individual features to model predictions differs from the baseline that was established during model training.
Monitoring data quality and model performance
Section titled “Monitoring data quality and model performance”How to monitor for different types of drift
Data quality monitoring
Section titled “Data quality monitoring”-
Implement data validation checks on your input data before feeding it to the model to ensure the data meets the expected format, range, and quality requirements. This can include checking for missing values, outliers, or inconsistent data types.
-
Calculate statistical metrics such as mean, standard deviation, missing value counts, and outlier counts on the input data.
-
Compare these metrics with baseline values or expected ranges established during the model development phase. Significant deviations from the baseline can indicate data quality issues or distribution shifts.
-
Use techniques like data drift detection to identify changes in the distribution of input data over time. This can involve monitoring the statistical properties of the data like mean, variance, or skewness. You can also use more advanced techniques like Kolmogorov-Smirnov tests or Maximum Mean Discrepancy to detect distributional shifts.
Model quality monitoring
Section titled “Model quality monitoring”-
Calculate relevant evaluation metrics (for example, accuracy, precision, recall, F1-score, AUC-ROC) on a held-out test set or a representative sample of production data. You can then assess the model’s performance on unseen data and compare it to the performance during training or previous monitoring cycles.
-
Implement techniques like confidence thresholding or uncertainty estimation to identify potentially unreliable predictions. For example, you can set a threshold on the model’s confidence score or use techniques like Monte Carlo Dropout to estimate the uncertainty of predictions.
-
Flag Predictions with low confidence or high uncertainty for further review or handled differently in the application.
-
Monitor the model’s performance on different subpopulations or slices of the data to detect potential performance degradation or bias issues. For example, you can calculate evaluation metrics separately for different demographic groups or data clusters.
Model bias drift monitoring
Section titled “Model bias drift monitoring”-
Calculate bias metrics (for example, disparate impact, equal opportunity difference, average odds difference) for different sensitive groups or subpopulations. These metrics quantify the degree of bias or unfairness in the model’s predictions with respect to protected attributes like race, gender, or age.
-
Compare the bias metrics with baseline values or acceptable thresholds established during the model development phase. Significant deviations from the baseline can indicate the introduction or amplification of bias in the model’s predictions.
-
Implement techniques like adversarial debiasing or calibrated equalized odds to mitigate bias during training or inference. These techniques aim to reduce the dependence of the model’s predictions on sensitive attributes or enforce fairness constraints.
Feature attribution drift monitoring
Section titled “Feature attribution drift monitoring”-
Use interpretability techniques like SHAP (SHapley Additive exPlanations) to calculate feature attributions or importance scores for individual predictions. These techniques provide insights into how different features contribute to the model’s predictions.
-
Calculate statistical metrics (for example, mean, standard deviation) on the feature attributions.
-
Compare the metrics with baseline values or expected ranges established during the model development phase. Significant deviations from the baseline can indicate changes in the importance or contribution of specific features over time.
-
Identify features whose attributions have changed significantly over time, as this might indicate underlying data or model drift. For example, if a feature that was previously important for the model’s predictions becomes less important, it could signal a change in the data distribution or the model’s behavior.
SageMaker Model Monitor
Section titled “SageMaker Model Monitor”SageMaker Model Monitor is a fully managed automatic monitoring service for your machine learning models. With SageMaker Model Monitor, you can continuously monitor the quality of SageMaker machine learning models in production.
How it works
Section titled “How it works”-
Baseline of the training dataset
SageMaker Model Monitor uses a baseline of the dataset used to train your model as a reference during monitoring.
-
Dataset statistics compared to incoming data
This baseline includes statistics about the dataset, such as the mean and standard deviation of each feature. After the baseline is created, SageMaker Model Monitor starts monitoring the incoming data. It compares the incoming data to the baseline and checks for any data quality issues.
-
Report generated
If SageMaker Model Monitor detects an issue, it generates a report that includes the details of the issue. The generated report is saved to an Amazon Simple Storage Service (Amazon S3) bucket that you specify.
Four types of monitoring
Section titled “Four types of monitoring”- Data quality
- Model quality
- Model bias drift
- Feature attribution drift
Benefits
Section titled “Benefits”-
Improved model performance and accuracy
By continuously monitoring the data quality, SageMaker Model Monitor helps ensure that the model is operating with the most accurate and reliable data. This, in turn, leads to improved model performance and accuracy.
-
Early detection of data quality issues
One of the primary benefits of SageMaker Model Monitor is its ability to quickly identify any issues with the data being used by the model. With this early detection, you can address these problems before they have a significant impact on the model’s performance, saving time and resources.
-
Reduced operational overhead for data monitoring
Traditionally, monitoring data quality has been a manual and time-consuming process. SageMaker Model Monitor automates this task, reducing the operational overhead associated with data monitoring. This helps your team to focus on other critical aspects of model development and deployment.
-
Compliance with data quality standards
Many industries and organizations have strict data quality standards that must be met. SageMaker Model Monitor helps ensure compliance with data quality standards, reducing the risk of regulatory or compliance-related issues.
Working together to support ML monitoring
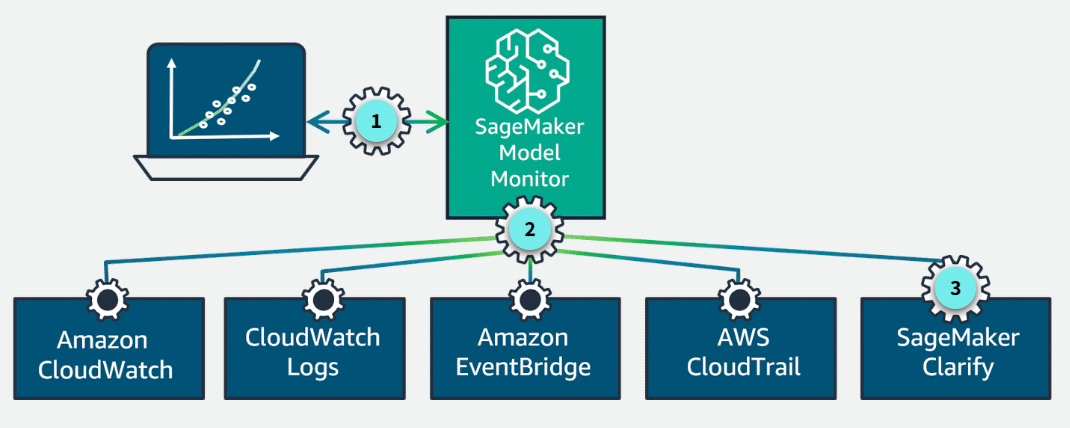
Section titled “Working together to support ML monitoring”SageMaker Model Monitor also works with other AWS services to support monitoring model performance.
-
Real-time monitoring
After a model is deployed in production, you can monitor its performance in real time using SageMaker Model Monitor.
-
Working together
SageMaker Model Monitor is a capability of SageMaker that emits per-feature metrics to CloudWatch. SageMaker is integrated with CloudWatch, Amazon CloudWatch Logs, EventBridge, and AWS CloudTrail for monitoring and auditing.
-
Integrated with SageMaker Clarify
Additionally, SageMaker Model Monitor is integrated with Amazon SageMaker Clarify to improve visibility into potential bias.
Use cases
Section titled “Use cases”-
Monitor real-time endpoints: You can set up continuous monitoring for models deployed to real-time endpoints. SageMaker Model Monitor captures data from model inputs and outputs and monitors for deviations compared to a baseline.
-
Monitor batch transform jobs: You can monitor models used in batch transform jobs, either running regularly or on a schedule. SageMaker Model Monitor captures the input data and output predictions from these batch jobs and monitors for drift. The schedule can be adjusted based on data availability and desired frequency.
-
On-demand monitoring job: SageMaker Model Monitor also supports on-demand monitoring jobs. These jobs can be launched manually to assess the performance at any time.
Schedule or run your monitor job
Section titled “Schedule or run your monitor job”To schedule monitoring jobs, you use cron expressions, which are strings that represent a schedule for running periodic tasks. In SageMarker Model Monitor, you can use the CronExpressionGenerator utility or provide custom cron expression strings to schedule SageMaker Model Monitor jobs at the desired frequency.
Monitor job status
Section titled “Monitor job status”- Completed: No violations were identified.
- Completed with violations: Constraint violations were detected.
- Failed: The monitoring job failed, possibly because of client error (such as incorrect role permissions) or infrastructure issues.
Output of SageMaker Model Monitor jobs
Section titled “Output of SageMaker Model Monitor jobs”-
Statistics
SageMaker Model Monitor output can include different types of statistics:
- Statistical parameters to be calculated for the baseline data and the data being captured.
- Dataset-level statistics like the item_count (number of rows or instances).
- Feature-level statistics for each feature or column in the dataset.
- Other statistics such as number of nulls, maximum value, minimum value, and mean.
-
Violations
The violations file lists the results of evaluating the constraints (specified in the constraints.json file) against the analyzed dataset. The report is output as constraints_violations.json.
-
Metrics
SageMaker Model Monitor emits per-feature metrics to CloudWatch, which you can use to set up dashboards and alerts. The summary metrics from CloudWatch are also visible in Amazon SageMaker Studio, and all statistics, monitoring results, and data collected can be viewed and further analyzed in a notebook.
-
Logs
Model Monitor generates logs with information about the monitoring job, such as the start time, end time, and status. You can view the logs in the CloudWatch console.
Monitoring for Data Quality Drift
Section titled “Monitoring for Data Quality Drift”How monitoring for data quality drift works
Section titled “How monitoring for data quality drift works”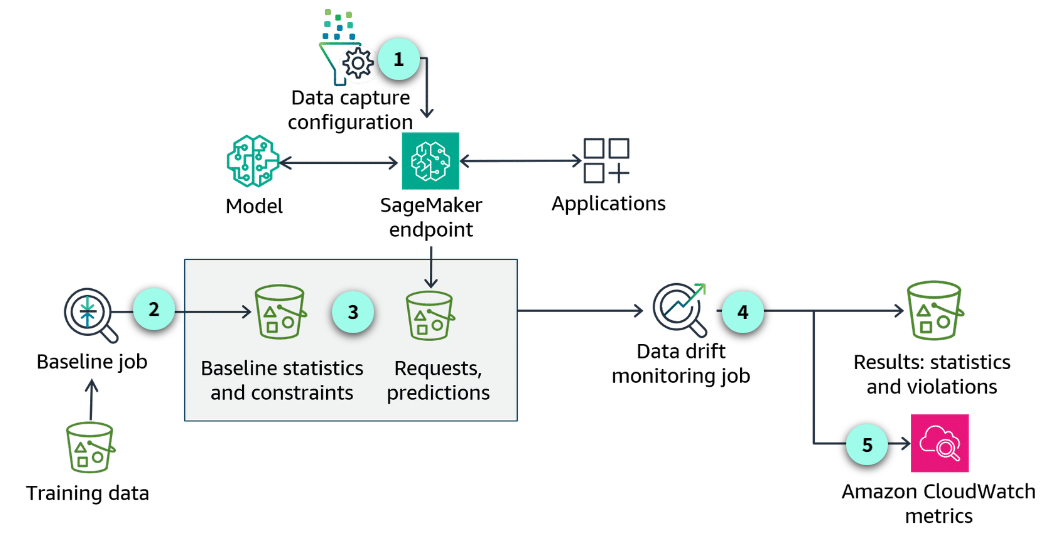
-
Data capture configuration
Set up the data capture configuration on the SageMaker endpoint.
-
Create a baseline
You can ask SageMaker to suggest a set of baseline constraints and generate descriptive statistics.
-
Baseline statistics and constraints
After the baseline runs, the output includes statistics about each feature of your training data.
-
Data drift monitoring job
Each monitoring job will capture new inference data from the deployed endpoint. It will compare the new data against the baseline. Any violations or data quality issues will be reported.
-
Amazon CloudWatch metrics
You can use the built-in SageMaker Model Monitor container for CloudWatch Metrics.
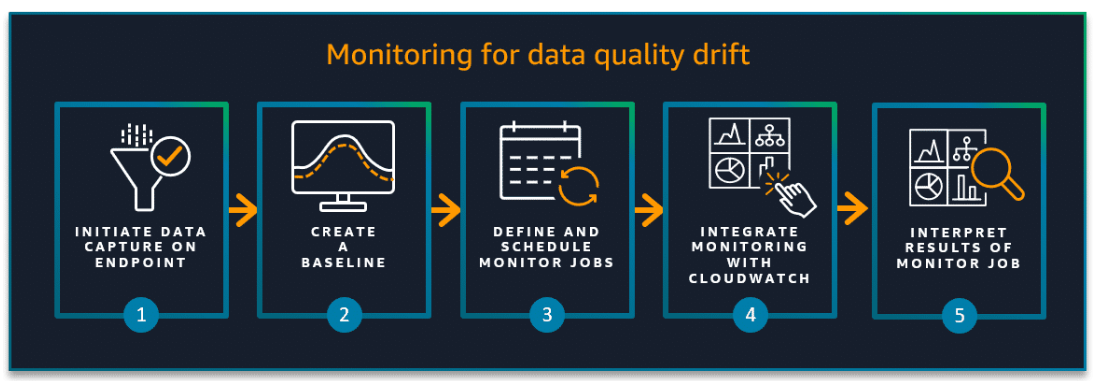
Steps to monitor data quality drift
Section titled “Steps to monitor data quality drift”- Initiate data capture on your endpoint.
- Create a baseline.
- Define and schedule data quality monitoring jobs.
- Integrate data quality monitoring with CloudWatch to view data quality metrics.
- Interpret and analyze the results of a monitoring job.
Monitoring for Model Quality Using SageMaker Model Monitor
Section titled “Monitoring for Model Quality Using SageMaker Model Monitor”How monitoring for model quality works
Section titled “How monitoring for model quality works”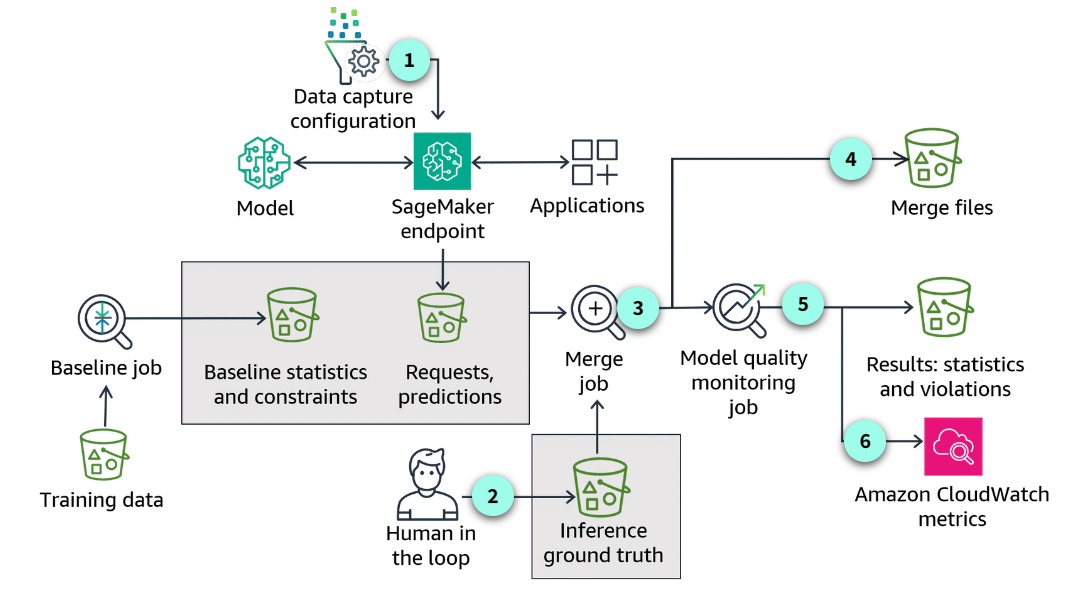
-
Similarities
Many parts of the process follow the same general approach as monitoring for data quality. The way you setup the data capture, the baseline job, and working with baseline statistics and constraints are the same. Working with requests and predictions are also consistent with other monitoring jobs.
-
Human in the loop
One significant difference is the human in the loop to verify the true labels or ground truth. Ground truth refers to the true labels or values for the data that a machine learning model is trying to predict or classify. Having ground truth allows you to evaluate how well a model’s predictions match reality.
-
Merge job
In this example, the monitoring job merges predictions with ground truth data to perform the comparison.
-
Merge files
Merged data is the intermediate result of model quality drift monitoring execution. The merged data is saved to JSON lines files in which each line is a valid JSON object combining the captured data and the ground truth data.
-
Results sent to S3
Reports, statistics, and violations are automatically sent to Amazon S3. Any violations, compared to the baseline performance, are captured in the violations file.
-
CloudWatch
You can configure CloudWatch alarms when model quality drifts beyond specified thresholds. You can use the CloudWatch alarms to trigger remedial actions such as retraining your model or updating the training data set.
Model quality monitoring job metrics
Section titled “Model quality monitoring job metrics”-
Binary classification metrics
- Confusion Matrix
- Accuracy
- Recall
- Precision
- True positive rate (TPR), true negative rate (TNR), false positive rate (FPR), false negative rate (FNR), true positive rate (TPR), true negative rate (TNR)
- AUC (Area Under the Curve)
- PR (Precision-Recall) and ROC (Receiver Operating Characteristic) Curves
- F1 score
-
Multiclass classification metrics
- Confusion matrix
- Weighted precision
- Weighted recall
- Weighted accuracy
- Weighted F1 score
-
Regression metrics
- MAE (Mean Absolute Error)
- MSE (Mean Squared Error)
- R-squared (R²)
Monitoring for Statistical Bias Drift with SageMaker Clarify
Section titled “Monitoring for Statistical Bias Drift with SageMaker Clarify”Options for using SageMaker Clarify
Section titled “Options for using SageMaker Clarify”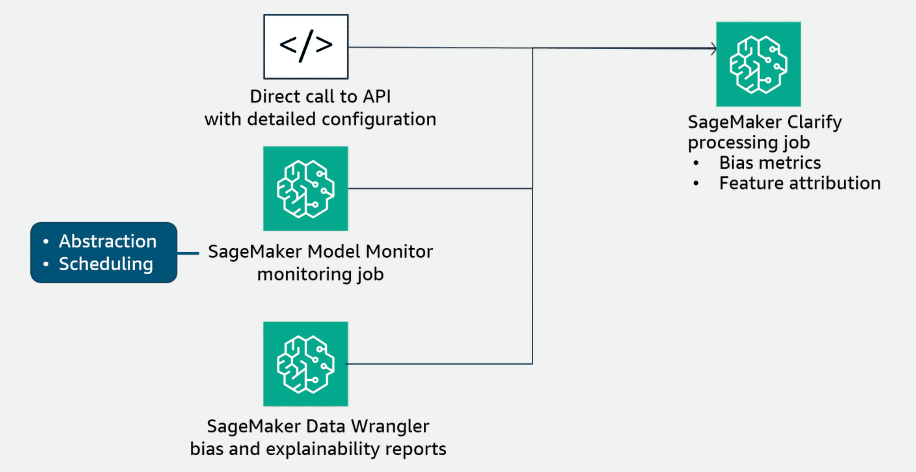
-
Use SageMaker Clarify directly
You can run SageMaker Clarify directly. In this scenario, you must configure a SageMaker Clarify processing job. The SageMaker Python SDK API provides a high-level wrapper that hides many of the details involved in setting up a SageMaker Clarify processing job. The details to set up a job include retrieving the SageMaker Clarify container image URI and generating the analysis configuration file. You can configure the job inputs, outputs, resources, and analysis configuration by using this API.
-
Use SageMaker Model Monitor
SageMaker Model Monitor uses SageMaker Clarify to analyze your data and models for bias and explainability. The process to set up this monitor is similar to the other monitoring types using SageMaker Model Monitor. In this case, you create a baseline that is specific to bias drift and then schedule your monitoring job like the other monitoring types.
Similar to monitoring for model quality, a bias drift monitoring job would first merge captured data and ground truth data, and then compute bias metrics on the merged data.
Bias drift jobs evaluate the baseline constraints provided by the baseline configuration against the analysis results of the current monitoring job. If violations are detected, the job lists them to the constraint_violations.json file in the execution output location and marks the execution status as interpret results.
As the model is monitored, you can view exportable reports and graphs detailing bias. You can also configure alerts in CloudWatch to receive notifications when bias breaches a certain threshold. To detect these changes, SageMaker Model Monitor uses SageMaker Clarify to continuously monitor the bias metrics of a deployed model.
For more information, see Post-training bias metrics in the Amazon SageMaker Developer Guide. -
Use SageMaker Data Wrangler
You can also use SageMaker Clarify within Amazon SageMaker Data Wrangler to identify potential bias during data preparation. You specify input features, such as gender or age, and SageMaker Clarify runs an analysis job to detect potential bias in those features.
For more information, see Monitor Bias Drift for Models in Production in the Amazon SageMaker Developer Guide.
Monitoring for Feature Attribution Drift
Section titled “Monitoring for Feature Attribution Drift”Feature attribution
Section titled “Feature attribution”Also known as feature importance or feature relevance
Feature attribution refers to understanding and quantifying the contribution or influence of each feature on the model’s predictions or outputs. It helps to identify the most relevant features and their relative importance in the decision-making process of the model.
A drift in the distribution of live data for production models can cause a corresponding drift in feature attribution values. SageMaker Model Monitor integration with SageMaker Clarify provides explainability tools for deployed models hosted in SageMaker. SageMaker Clarify’s feature attribution monitoring helps you monitor predictions and detect feature attribution drift (explainability). It provides insights into how the models make predictions, which can be useful for debugging, improving model performance, and ensuring fairness and transparency.
Monitoring for feature attribution drift
Section titled “Monitoring for feature attribution drift”How to set up
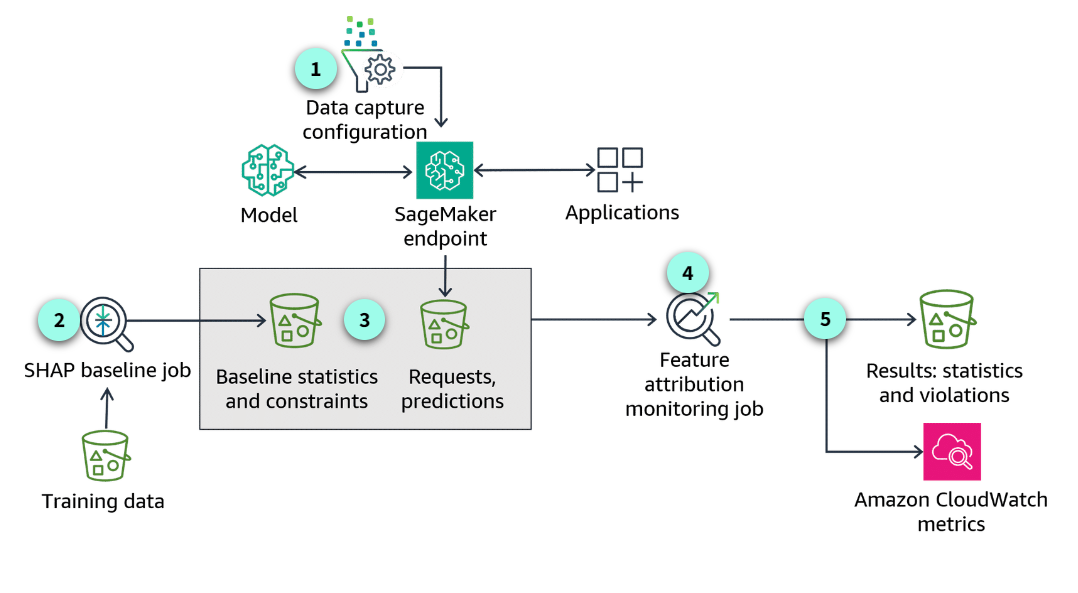
-
Data capture configuration
As with the other model monitoring approaches, you first need to activate data capture for your endpoint.
-
Create a baseline
After you have configured your application to capture real-time or batch transform inference data to monitor for drift in feature attribution, you create a baseline to compare against. This involves configuring the data inputs, which groups are sensitive, how the predictions are captured, and the model and its post-training bias metrics.
-
Baseline statistics and constraints
When the baselining job completes, SageMaker will suggest a set of baseline constraints and generate descriptive statistics.
-
Data drift monitoring job
Again, similar to the other monitoring types, feature attribution drift jobs evaluate the baseline constraints against the analysis results of the latest monitoring job. If violations are detected, the job lists them in the constraint_violations.json file. The model explainability monitor calculates a normalized, global SHAP score for the model, which compares feature attribution for live production data with the baseline.
-
Amazon CloudWatch metrics
Feature attribution drift violations occur when the global SHAP scores fall below a threshold. You can view exportable reports and graphs detailing bias and feature attributions in SageMaker Studio. You can also configure alerts in Amazon CloudWatch to receive notifications if violations are detected.
Example violations file output
Section titled “Example violations file output”Here is an example of the violations file output.
{ "version": "1.0", "violations": [ { "label": "label0", "metric_name": "shap", "constraint_check_type": "feature_attribution_drift_check", "description": "Feature attribution drift 0.7639720923277322 exceeds threshold 0.9" }, { "label": "label1", "metric_name": "shap", "constraint_check_type": "feature_attribution_drift_check", "description": "Feature attribution drift 0.7323763972092327 exceeds threshold 0.9" } ]}SageMaker Model Monitor benefits
Section titled “SageMaker Model Monitor benefits”
Monitoring Model Performance Using A/B Testing
Section titled “Monitoring Model Performance Using A/B Testing”What is A/B testing?
Section titled “What is A/B testing?”A/B testing, also known as split testing or bucket testing, is a technique that lets you evaluate the relative performance of two or more models simultaneously. This method lets you evaluate with real-world data and live production traffic. By running multiple models in parallel and exposing them to a controlled subset of production traffic, you can gather valuable insights into their respective strengths, weaknesses, and real-world performance characteristics.
Using A/B testing to monitor for model performance
Section titled “Using A/B testing to monitor for model performance”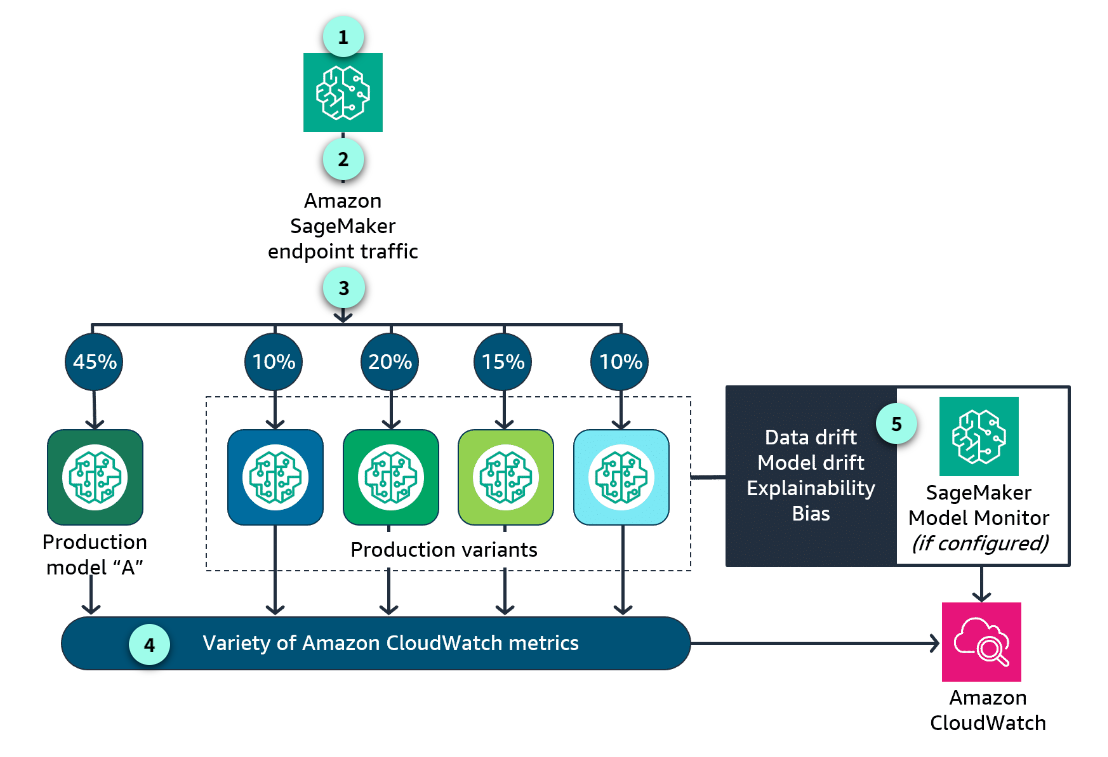
-
The production environment
In this approach, the production environment is updated to support both the existing production model variant and the candidate replacement model variant.
-
Routing inference requests
The inference requests are randomly routed to A (current production variant) or B (candidate variant). This method is directly supported by the traffic-routing capabilities of the multi-model endpoint deployment in SageMaker.
-
The distribution of traffic
You can test models by specifying the distribution of invocation traffic. In this example, 45 percent of the requests are going to the production model. 10 percent goes to variant 1, 20 percent to variant 2, 15 percent to variant 3, and 10 percent to variant 4. You can also test models that offer a new feature by invoking the specific model directly for each request.
-
Metrics are emitted
SageMaker emits a large variety of CloudWatch metrics. You can monitor latency, number of invocations, and how invocations were distributed among the multiple variants.
-
Enable and configure
Other metrics are specific to how the model is performing, emitted by SageMaker Model Monitor as CloudWatch metrics. This feature is not enabled by default. To take advantage of SageMaker Model Monitor metrics, you need to enable and configure this feature to capture the metrics associated with the specific monitoring type.
When to use A/B testing
Section titled “When to use A/B testing”-
Real-world data distribution differs from training data: Real-world data distribution differs from training data, leading to potential performance discrepancies in production.
-
Detecting unintended Consequences: A/B testing can help identify unintended consequences or edge cases that might not have been captured during offline testing, such as data drift, concept drift, or unexpected user behavior.
-
User interactions and feedback: Some models, such as recommendation systems or conversational agents, rely heavily on user interactions and feedback, which can be challenging to simulate during offline evaluation.
-
Dynamic environments: In rapidly changing environments, such as ecommerce or finance, models might have to adapt quickly, making A/B testing a valuable tool for continuous monitoring and improvement.
-
Business impact assessment: When deploying a new or updated model, it’s crucial to understand its impact on key business metrics such as revenue, customer satisfaction, or user engagement. A/B testing facilitates a direct comparison of these metrics between the current and candidate models.
-
High-stakes decisions: A/B testing can be used when the consequences of deploying an underperforming model are severe, such as in healthcare or financial applications. This type of testing provides an additional layer of validation before fully committing to a new model.
Benefits
Section titled “Benefits”-
Realistic performance evaluation:
By exposing models to real-world data and user interactions, A/B testing provides a more accurate assessment of model performance in production environments. This approach helps identify potential issues or biases that might not be apparent during offline testing or evaluation.
-
Data-driven decision making:
By comparing the performance of different models in a live production environment, you can objectively assess which model delivers the best results for your specific requirements. This approach helps mitigate the risk of deploying an underperforming model, helping your application consistently deliver optimal performance and user experience.
-
Continuous monitoring:
A/B testing lets you monitor model performance continuously, helping you to detect and respond to performance degradation or concept drift promptly. By regularly evaluating and comparing the performance of multiple models, you can proactively identify and address potential issues, minimizing the impact on your application and users.
-
Risk mitigation:
By gradually rolling out new models to a subset of users or data, A/B testing mitigates the risk of widespread performance issues or negative impacts.
-
User experience optimization:
In applications where user experience is critical, A/B testing can help identify and optimize the model variant that delivers the best user experience.
-
Controlled experimentation:
By exposing models to a controlled subset of production traffic, you can isolate and analyze the impact of model changes or updates, supporting more informed decision-making and iterative improvements.
-
Improved model performance:
By directly comparing models in a live environment, A/B testing can help identify and select the best-performing model, leading to improved accuracy, efficiency, and overall model performance.
-
Increased confidence and trust:
Successful A/B testing results can increase stakeholder confidence and trust in the deployed models, as their performance has been validated in a live production environment.
Introduction to SageMaker Model Dashboard
Section titled “Introduction to SageMaker Model Dashboard”A centralized portal
Section titled “A centralized portal”SageMaker Model Dashboard is a centralized portal in the SageMaker console, where you can view, search, and explore all the models in your account. The dashboard provides a comprehensive presentation of model monitoring results.
If you set up monitors with SageMaker Model Monitor, you can also track your models’ performance as they make real-time predictions on live data. SageMaker Model Dashboard also helps you quickly identify models that don’t have these metrics configured.
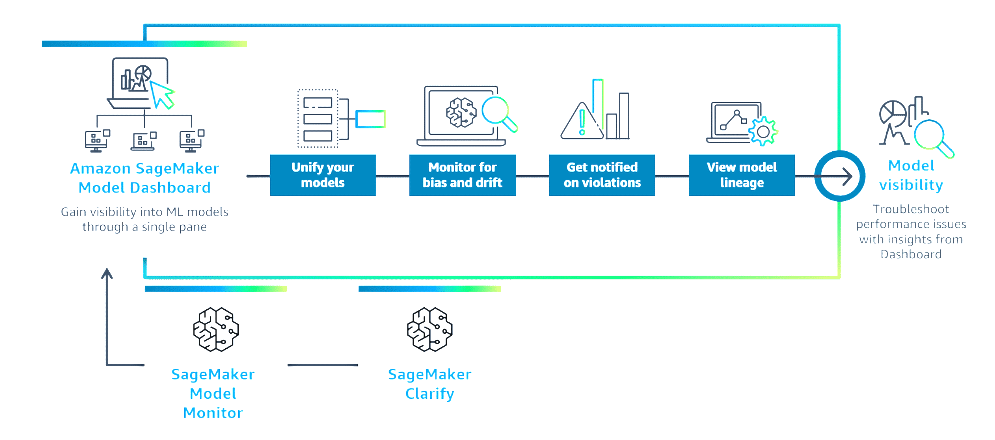
The SageMaker Model Dashboard displays aggregated model-related information from other SageMaker features. You can view model cards, visualize workflow lineage, and track your endpoint performance. SageMaker Model Dashboard provides an included model governance solution to help you review quality coverage across your models.
Features
Section titled “Features”-
Alerts
SageMaker Model Monitor alerts are a primary focus of the SageMaker Model Dashboard. The SageMaker Model Dashboard populates information from all the monitors you create on all of the models in your account. You can track the status of each monitor, which indicates whether your monitor is running as expected or failed because of an internal error.
The SageMaker Model Dashboard displays alerts you configured in CloudWatch. You can modify the alert criteria in the dashboard itself. The alert criteria depend upon two parameters:- Datapoints to alert: Within the evaluation period, how many runtime failures raise an alert?
- Evaluation period: The number of most recent monitoring executions to consider when evaluating alert status.
-
Risk rating
A user-specified parameter from the model card with a low, medium, or high value. The model card’s risk rating is a categorical measure of the business impact of the model’s predictions. Models are used for various business applications, each assuming a different risk level. For example, incorrectly detecting a cyber-attack has greater impact than incorrectly categorizing an email. If the model risk is unknown, it can be set as such.
-
Endpoint performance
The endpoints which host your model for real-time inference. In the SageMaker Model Dashboard, you can select the endpoint column to view performance metrics, such as:
- CpuUtilization: The sum of each individual CPU core’s utilization, with each ranging from 0%-100%.
- MemoryUtilization: The percentage of memory used by the containers on an instance, ranging from 0%-100%.
- DiskUtilization: The percentage of disk space used by the containers on an instance, ranging from 0%-100%.
-
Most recent batch transform job
You can view the most recent batch transform job that ran using this model. This information helps you determine if a model is actively used for batch inference.
-
Model lineage graphs
When training a model, SageMaker creates a model lineage graph, a visualization of the entire ML workflow from data preparation to deployment. This graph uses entities to represent individual workflow steps, such as the training set, training job, and model.
The graph also stores information about each step, so that you can recreate any step or track model and dataset lineage. For instance, SageMaker Lineage records the Amazon S3 URL of input data sources with each job, facilitating further data source analysis for compliance verification. -
Links to model details
The dashboard links to a model details page where you can explore an individual model. This page displays the model’s lineage graph, which visualizes the workflow from data preparation to deployment, as well as metadata for each step. You can also create and view the model card, review alert details and history, assess the performance of real-time endpoints, and access other infrastructure-related details.
Choosing Your Monitoring Approach
Section titled “Choosing Your Monitoring Approach”Remediating Problems Identified by Monitoring
Section titled “Remediating Problems Identified by Monitoring”Automated Remediation and Troubleshooting
Section titled “Automated Remediation and Troubleshooting”Resources
Section titled “Resources”Machine Learning Lens Use this resource to learn more about the AWS Well-Architected Framework Machine Learning Lens. It describes the monitoring phase and lists key components of the ML lifecycle.
Detecting data drift using Amazon SageMaker Visit this resource from the AWS Architecture Blog post on detecting data drift using SageMaker. It includes guidance on how to detect drift, build a feedback loop, and gain insights into data and models.
Monitor data and model quality with Amazon SageMaker Model Monitor Visit this resource from the SageMaker Developer Guide. This resource provides an overview of SageMaker Model Monitor’s capabilities.
Monitor data quality Visit this resource from the SageMaker Developer Guide. It includes guidance for how to use SageMaker Model Monitor to monitor data quality.
Monitor Bias Drift for Models in Production Visit this resource to learn more on guidance for how to use SageMaker Model Monitor to monitor for bias drift.
Monitor Feature Attribution Drift for Models in Production Visit this resource to learn more about guidance for how to use SageMaker Model Monitor to monitor for feature attribution drift.
Amazon SageMaker Model Monitor This site highlights example Jupyter notebooks for a variety of machine learning monitoring use cases for SageMaker Model Monitor.
Detect NLP data drift using custom Amazon SageMaker Model Monitor Visit this resource to learn about detecting Natural Language Processing data drift using SageMaker Model Monitor. This includes guidance for how to use SageMaker Model Monitor to measure data drift.
A/B testing with Amazon SageMaker Visit this resource from SageMaker Examples documentation. This site highlights example Jupyter notebooks to use for A/B testing using SageMaker.
Improve governance of your machine learning models with Amazon SageMaker This blog covers guidance on using SageMaker Model Cards and the SageMaker Model Dashboard to improve visibility and governance over machine learning models.
Automate model retraining with Amazon SageMaker Pipelines when drift is detected This AWS Machine Learning blog is about automated model retraining. It includes guidance for how to set up an automated model retraining solution using SageMaker Pipelines.