Graph Thinking
The Seven Bridges
Section titled “The Seven Bridges”Once upon a time…
Section titled “Once upon a time…”To find out how we got here, we first need to take a trip back in time.
It’s 1736, in Königsberg, Prussia.
Leonhard Euler is presumably sitting at his desk, with a dilemma. Kongsberg (modern day Kaliningrad, Russia) is divided by the Pregel River into four sections which are connected by seven bridges.
The question that Euler is pondering is: Can we take a walk through the city that would cross each of the seven bridges only once?
Foundation for graph theory
Section titled “Foundation for graph theory”He eventually solved the problem by reformulating it, and in doing so laid the foundations for graph theory.
He realized that the land masses themselves weren’t an important factor. In fact, it was the bridges that connected the land masses that were the most important thing.
His approach was to define the problem in abstract terms, taking each land mass and representing it as an abstract vertex or node, then connecting these land masses together with a set of seven edges that represent the bridges. These elements formed a “graph”.
Applying the theory
Section titled “Applying the theory”Using this abstraction, Euler was able to definitively demonstrate that there was no solution to this problem. Regardless of where you enter this graph, and in which order you take the bridges, you can’t travel to every land mass without taking one bridge at least twice.
But it wasn’t a completely wasted effort. Although graphs originated in mathematics, they are also a very convenient way of modeling and analyzing data. While there is certainly value in the data that we hold, it is the connections between data that can really add value. Creating or inferring relationships between your records can yield real insights into a dataset.
Fast forward 300 years and these founding principles are used to solve complex problems including route finding, supply chain analytics, and real-time recommendations.
Graph elements
Section titled “Graph elements”Let’s take a closer look at the two elements that make up a graph:
Nodes (also known as vertices)
Relationships (also known as edges)

Nodes (or vertices) are the circles in a graph. Nodes commonly represent objects, entities, or merely things.
In the Seven Bridges of Königsberg example in the previous lesson, nodes were used to represent the land masses.
Another example that everyone can relate to is the concept of a social graph. People interact with each other and form relationships of varying strengths.
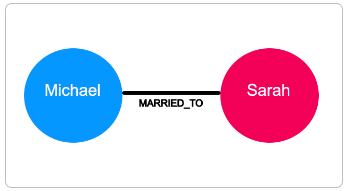
The diagram to the right has two nodes which represent two people, Michael and Sarah. On their own, these elements are uninspiring. But when we start to connect these circles together, things start to get interesting.
Nodes typically represent things
Section titled “Nodes typically represent things”Examples of entities that could typically be represented as a node are: person, product, event, book or subway station.
Relationships
Section titled “Relationships”Two nodes representing Michael and Sarah and connected by a MARRIED_TO relationship Relationships (or edges) are used to connect nodes. We can use relationships to describe how nodes are connected to each other. For example Michael has the WORKS_AT relationship to Graph Inc because he works there. Michael has the MARRIED_TO relationship to Sarah because he is married to her.
All of a sudden, we know that we are looking at the beginnings of some sort of social graph.
Now, let’s introduce a third person, Hans, to our Graph.
Hans also works for Graph Inc along with Michael. Depending on the size of the company and the properties of the relationship, we may be able to infer that Michael and Hans know each other.
If that is the case, how likely is it that Sarah and Hans know each other?
These are all questions that can be answered using a graph.
Relationships are typically verbs.
Section titled “Relationships are typically verbs.”We could use a relationship to represent a personal or professional connection (Person knows Person, Person married to Person), to state a fact (Person lives in Location, Person owns Car, Person rated Movie), or even to represent a hierarchy (Parent parent of Child, Software depends on Library).
Graph Structure
Section titled “Graph Structure”Graph characteristics and traversal
Section titled “Graph characteristics and traversal”There are a few types of graph characteristics to consider. In addition, there are many ways that a graph may be traversed to answer a question.
Directed vs. undirected graphs
Section titled “Directed vs. undirected graphs”In an undirected graph, relationships are considered to be bi-directional or symmetric.

An example of an undirected graph would include the concept of marriage. If Michael is married to Sarah, then it stands to reason that Sarah is also married to Michael.
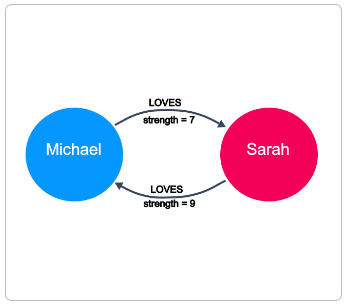
A directed graph adds an additional dimension of information to the graph. Relationships with the same type but in opposing directions carry a different semantic meaning.

For example, if marriage is a symmetrical relationship, then the concept of love is asymmetrical. Although two people may like or love each other, the amount that they do so may vary drastically. Directional relationships can often be qualified with some sort of weighting. Here we see that the strength of the LOVES relationship describes how much one person loves another.
At a larger scale, a large network of social connections may also be used to understand network effects and predict the transfer of information or disease. Given the strength of connections between people, we can predict how information would spread through a network.
Weighted vs. unweighted graphs
Section titled “Weighted vs. unweighted graphs”The concept of love is also an example of a weighted graph.
In a weighted graph, the relationships between nodes carry a value that represents a variety of measures, for example cost, time, distance or priority.
A basic shortest path algorithm would calculate the shortest distance between two nodes in the graph. This could be useful for finding the fastest walking route to the local store or working out the most efficient route to travel from city to city.

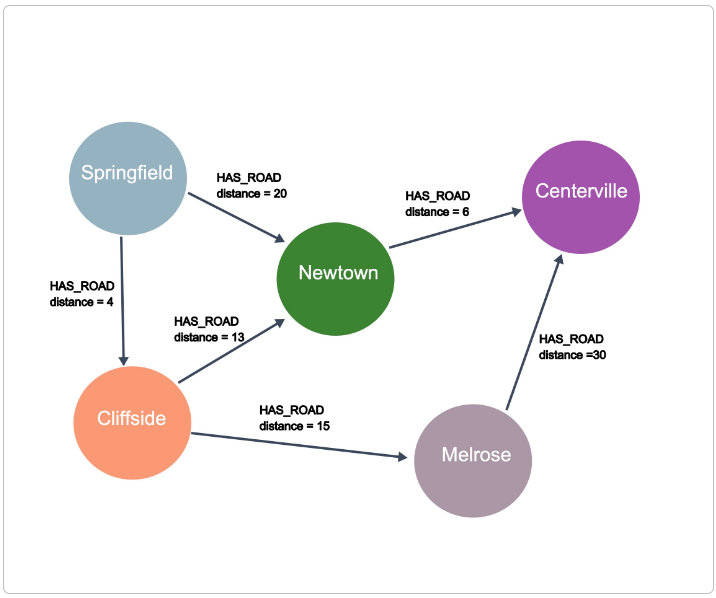
In this example, the question that we might have for this graph is: What is the shortest drive from Springfield to Centerville? Using the HAS_ROAD relationships and the distance for these relationships, we can see that the shortest drive will be to start in Springfield, then go to Cliffside, then to Newtown, and finally arrive in Centerville.
More complex shortest path algorithms (for example, Dijkstra’s algorithm or A* search algorithm) take a weighting property on the relationship into account when calculating the shortest path. Say we have to send a package using an international courier, we may prefer to send the package by air so it arrives quickly, in which case the weighting we would take into account is the time it takes to get from one point to the next.
Inversely, if cost is an issue we may prefer to send the package by sea and therefore use a property that represents cost to send the package.
Graph traversal
Section titled “Graph traversal”How one answers questions about the data in a graph is typically implemented by traversing the graph. To find the shortest path between Springfield to Centerville, the application would need to traverse all paths between the two cities to find the shortest one.
-
Springfield-Newtown-Centerville = 26
-
Springfield-Cliffside-Newtown-Centerville = 23
-
Springfield-Cliffside-Melrose-Certerville = 49
Traversal implies that the relationships are followed in the graph. There are different types of traversals in graph theory that can impact application performance. For example, can a relationship be traversed multiple times or can a node be visited multiple times?
Neo4j’s Cypher statement language is optimized for node traversal so that relationships are not traversed multiple times, which is a huge performance win for an application.
Graphs are Everywhere
Section titled “Graphs are Everywhere”MATCH (c:Category)-[:HAS_CHILD|HAS_PRODUCT*1..3]->(p:Product)RETURN p.id, p.title, collect(c.name) AS categoriesLearn more at GraphGists.